The growth deficit in height cannot easily be translated or compared to weight due to the greatly distorted ratio between trunk and legs, which also changes with age, and possibly also due to increased head size. Although the use of weight for height curves takes the severity of short stature and body disproportion into account, age-dependent physiologic/ metabolic situation is neglected. The metabolic situation of an adult with height of 130 cm would then incorrectly be compared to that of a prepubertal child of normal population. (See table)
Height (cm) | |||||
| 90 | 100 | 110 | 120 | 130 | 140 | 2.5 | 3.5 | 5.0 | 7.0 | 8.5 | 10.5 |
Age (CA) in normal population | |||||
BMI for age is likewise misleading in its absolute value. The absolute BMI value becomes considerably increased in achondroplasia compared to the general population due to pronounced body disproportion with short legs.
The physiologic meaning of the position in the normal BMI curve may therefore be unclear. Note that the infancy peak and adiposity rebound, as typical for the general population is not seen in the achondroplasia BMI curve.
The BMI-axis in the clinical chart is not made linear in order to give a balanced attention to upper and lower BMI ranges. On linear scales more chart space is dedicated to the higher BMI ranges that, due to the right‑skew in the BMI distribution, are broader than at lower BMI.
International Obesity Task Force (IOTF) cut-offs for overweight and obesity in normal population overlap, as seen, with normal achondroplasia BMI ranges.
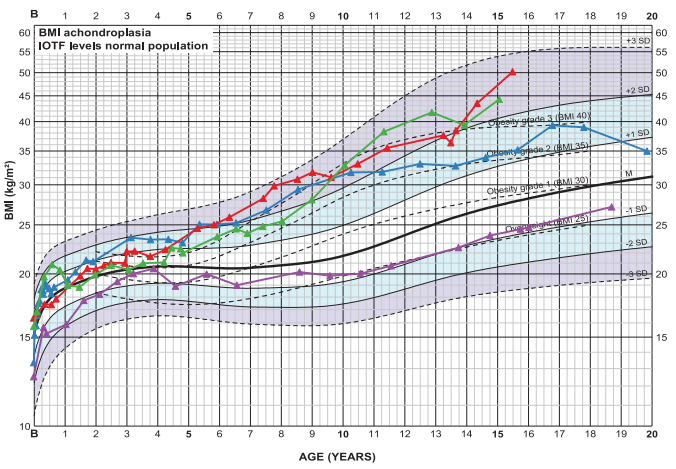
BMI chart for boys with achondroplasia. Mean±3SD. IOTF levels 25, 30, 35, 40, of normal population indicated. Examples of development shown.