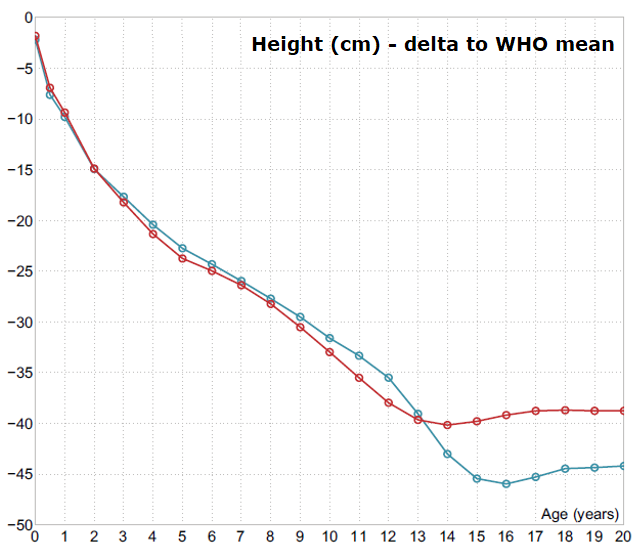
Height development in achondroplasia compared to the general population (WHO reference): expressed as loss of height in cm. Blue: Boys, Red: Girls.
From Andrea Merker 2018 Growth in achondroplasia
Birth length and postnatal growth during the first months of life is relatively normal in achondroplasia but thereafter growth velocity abruptly slows down causing a major decrease in height position in the general population growth curve, approaching −4.0 standard deviation score (SDS) before 1 year of age and −5.0 SDS at 2 years of age. This position is approximately maintained during childhood growth while an additional SDS in height position is lost during pubertal ages. Adult height is roughly −6.0 SDS in both sexes, which is 45/ 40 cm shorter than males/ females in the general population.
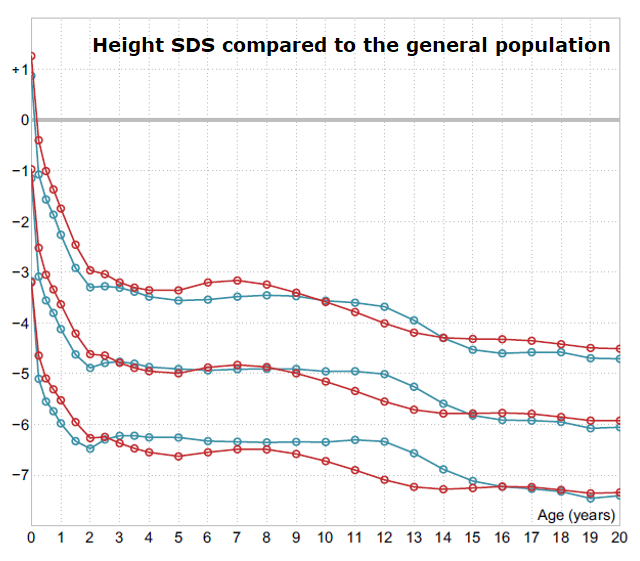
Height development in achondroplasia compared to the general population (WHO reference): expressed as height SDS, mean ±2 SD. Blue: Boys, Red: Girls
From Andrea Merker 2018 Growth in achondroplasia
Height SDS at selected ages
There exists several growth references for achondroplasia. Comparing these might then be of interest when chosing standard for following the patient. An overview comparing height SDS in some of the references at selected ages using WHO growth standard is found in the table below. For adult height also a more comprehensive comparison between all available standards is found in the second table.
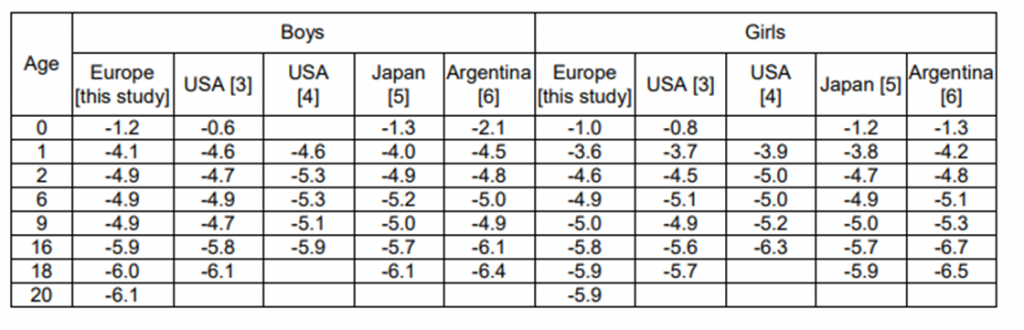
Height SDS at selected ages in various achondroplasia references expressed relative to the general population (WHO standard).
From Andrea Merker Thesis 2018
Variability in height – Comparison to other skeletal dysplasias: Compared to other common skeletal dysplasias, e.g. many clinical entities in the type I and type II collagen spectra, the auxological phenotype in achondroplasia is homogenous with low variability in height and body proportion both within and between families.
It could be argued that this homogeneity is due to the fact that the constitutionally activating mutation in FGFR3 is almost universally uniform and likely to confer near maximal negative influence on growth of the extremities (for review see Foldynova-Trantirkova 2012, Qi 2014). This will then leave for only marginal modulating effect from parental or background population stature.
Pubertal growth: A pubertal growth spurt might be difficult to identify from mean values in height references, but individual growth patterns show a clear acceleration during early pubertal ages; that is, around 12 years for boys and 10 years for girls.
Pubertal growth component, i.e. height gain from start of puberty until adult height, is roughly 19 cm or 14-15% of adult height. Similarly, clinical experience speaks for normal pubertal development in achondroplasia.
Comparing achondroplasia references: Despite differences in height of background populations, ages for reporting adult height and data collection periods, adult height is remarkably similar between achondroplasia growth studies (see table below).
Secular trends in height or the influence of background population, which is primarily dependent on changes in leg length (Bogin & Varela-Silva 2010; Tanner 1982), is not or only marginally detectable in achondroplasia with its maximal growth inhibition of extremities.
Pubertal growth |
A pubertal growth spurt might be difficult to identify from mean values in height references, but individual growth patterns show a clear acceleration during early pubertal ages; that is, around 12 years for boys and 10 years for girls.
Pubertal growth component, i.e. height gain from start of puberty until adult height, is roughly 19 cm or 14-15% of adult height. Similarly, clinical experience speaks for normal puberta development in achondroplasia.
Variability in height - Comparison to other skeletal dysplasias |
Compared to other common skeletal dysplasias, e.g. many clinical entities in the type I and type II collagen spectra, the auxological phenotype in achondroplasia is homogenous with low variability in height and body proportion both within and between families.
It could be argued that this homogeneity is due to the fact that the constitutionally activating mutation in FGFR3 is almost universally uniform and likely to confer near maximal
negative influence on growth of the extremities (for review see Foldynova-Trantirkova 2012, Qi 2014). This will then leave for only marginal modulating effect from parental or background population stature.
Comparing achondroplasia references |
Despite differences in height of background populations, ages for reporting adult height and data collection periods, development of height and adult height is remarkably similar between achondroplasia growth studies (see
tables below).
Secular trends in height or the influence of background population, which is primarily dependent on changes in leg length (Bogin & Varela-Silva 2010; Tanner 1982), is not or only marginally detectable in achondroplasia with its maximal growth inhibition of extremities.
Adult height in different achondroplasia references in cm and SDS relative to WHO reference (de Onis 2007)
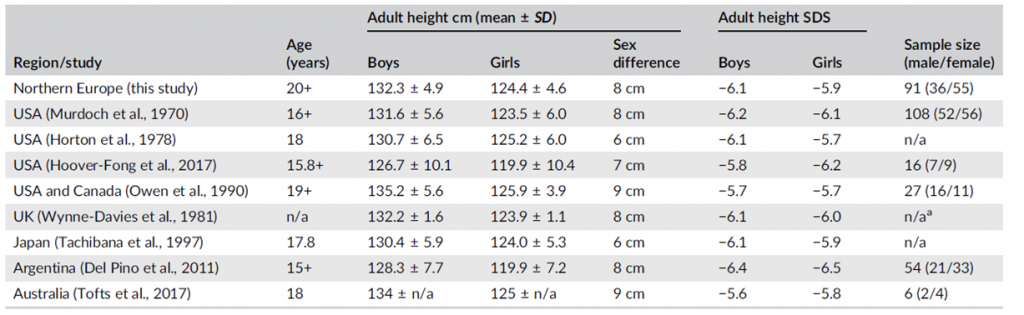
If data were not published in text or tabled format, values were read from illustrations in the respective publication. Missing information is indicated as n/a. The age column indicates how final height was defined (ages contributing to adult height). Note that adult height calculations in some studies are based on small samples (from Merker 2018 growth in achondroplasia). a) Visually read from figure n = 17 (3 male/14 female >17.5 years).