Sitting Height
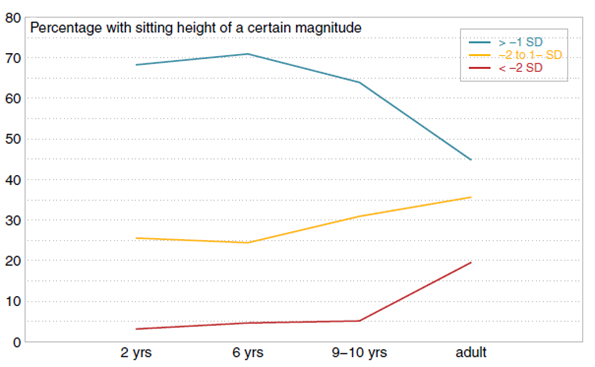
Sitting height in achondroplasia develops within lower normal range and deviation from the general population during prepubertal ages is remarkably constant, counted in centimeter, but increase slightly during ages of pubertal induction from sex hormones. At 6 years of age, sitting height is above -2 SD in almost all children (only 5% below -2 SD) compared to roughly 20% of adults. Growth of the spine, expressed as annual increments of sitting height, is only slightly lower compared to general population references.
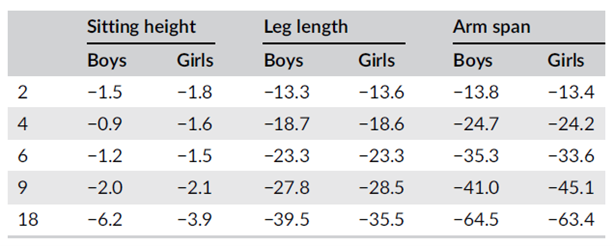
Table shows difference achondroplasia (Merker 2018) to normal population (Dangour 2002; Gerver 2011) Sitting height is only marginally affected in achondroplasia compared to leg length and arm span that are remarkably shorter already at 2 years of age.
From Merker 2018, Development of body proportions in achondroplasia
Development of sitting height SDS for age in achondroplasia relative to UK reference (Dangour 2002). Sexes were combined since there were no sex differences.
From Merker 2018, Development of body proportions in achondroplasia
Relative Sitting Height
Sitting height as proportion of total height, i.e. relative sitting height, is an informative and valuable measure for following body disproportions. In hypochondroplasia, adult relative sitting height might be 57% compared to 67% in achondroplasia and 52% in the general population.
Relative sitting height can therefore be important for diagnosing; the figure below shows two examples of FGFR3 mutations: a girl with achondroplasia (in blue) and one with hypochondroplasia (in green). Despite almost identical absolute sitting height, relative sitting height is significantly lower in the girl with hypochondroplasia. In other words, body disproportion is less severe.
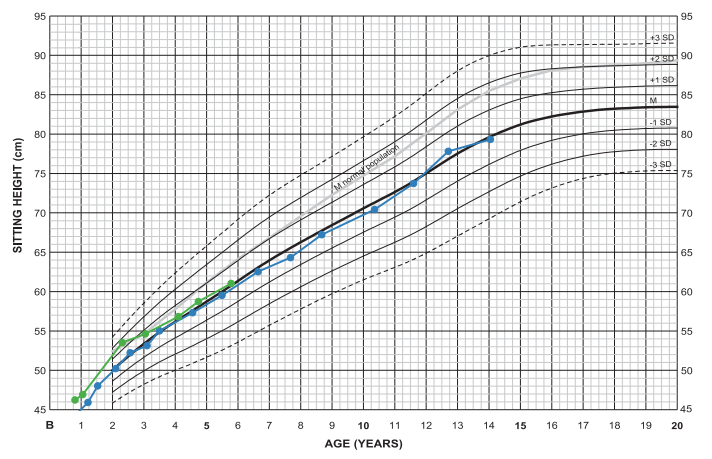
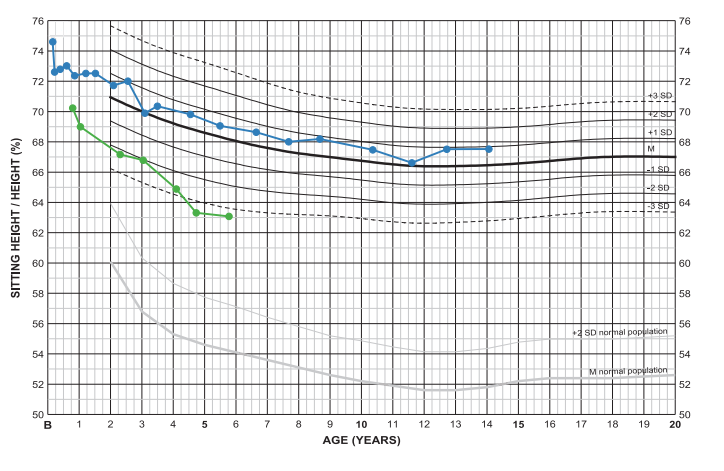
At 6 years of age, sitting height is −0.1 and +0.1 SDS respectively at a relative sitting height of +0.5 and −3.4 SDS.
Height corresponds to −0.3 and +1.9 SDS of achondroplasia standard.
From Merker 2020, Clinical charts in achondroplasia
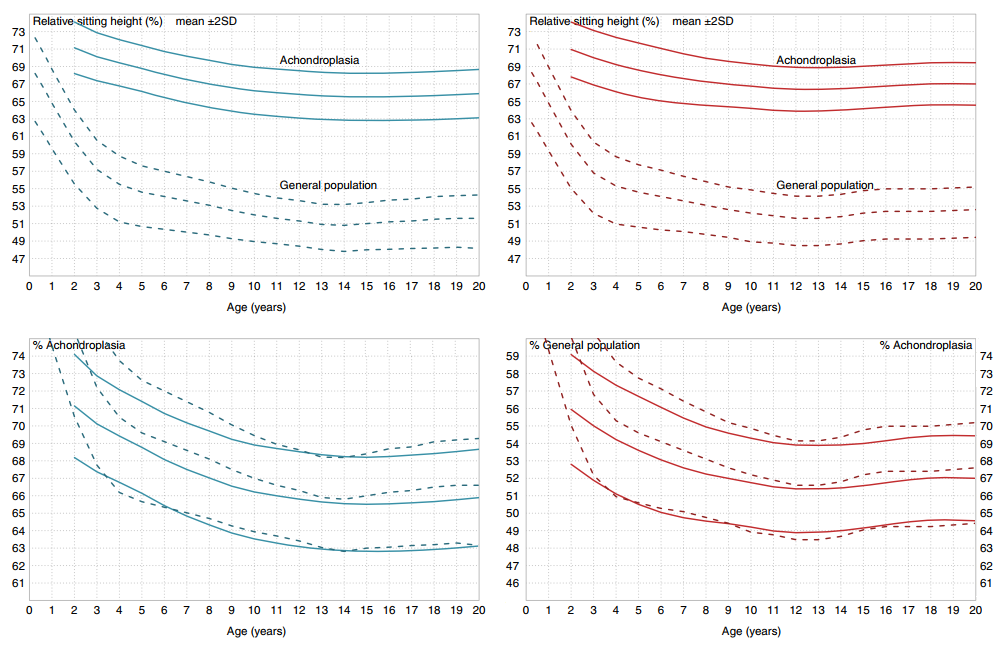
Relative sitting height in achondroplasia (line) and the general population (dashed) with, above, one common y-axis and, below, with two y-axes separated for disproportional (achondroplasia, outer y-axis) and general population (inner y-axis). When scales are adjusted by 15% units, the achondroplasia mean follow normal population (Dutch, NL ’97 (Fredriks 2005)) development rather well.
From Merker 2018, Development of body proportions in achondroplasia
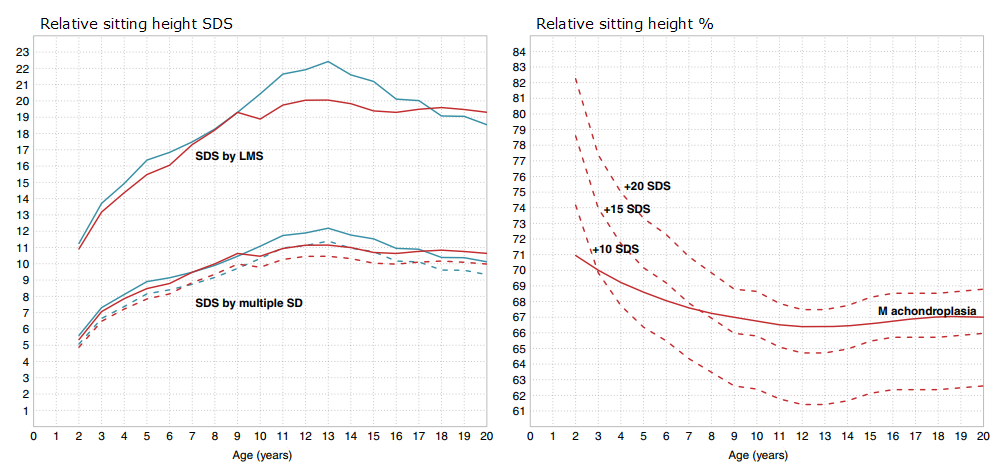
Extremes of relative sitting height SDS: Since body disproportion is substantial in achondroplasia, calculating the exact relative sitting height SDS is heavily dependent on background reference and whether a fixed SD or LMS-approach is used.
Left: Relative sitting height SDS for age in boys (blue) and girls (red) with achondroplasia using LMS-approach or using multiple SD where SD is defined as distance between mean and +1 SDS (line) or as average of ±2 range (dotted).
Right: Extreme (+10, +15, and +20) SDS-positions in the general population (Fredriks 2005) calculated by LMS and achondroplasia mean (girls); the distance between +10 and +20 SDS is small in relative size considering that this area covers 10 SDS positions.
From Merker 2018, Development of body proportions in achondroplasia
Leg length and Arm span
Deviations in legs and arms from that of normal population increase with age, which might also be influenced by increasing varus deformity of the legs and increasing inability to fully extend elbows.
Leg length is not measured but calculated as difference between height and sitting height (=subischial leg length – SILL). Legs of an adult with achondroplasia is roughly 40 cm shorter than in the general population (males having 4 cm longer legs than females compared to 8 cm in general population). Already at 2 years of age is leg length on average 14 cm shorter than in peers of normal height. Expressed as SDS, leg length develops from −7.0 at 2 years of age to −8.0 at 4 years and 8.5 to -9 SDS in adulthood.
Similarly, arm span is at 2 years of age almost 14 cm shorter than in the general population and this deviation almost doubles until 5 years of age. At adult ages, arm span is 122/110 cm in male/female; almost 65 cm shorter than in adults of normal height and thus creating 35/37% less range of motion.
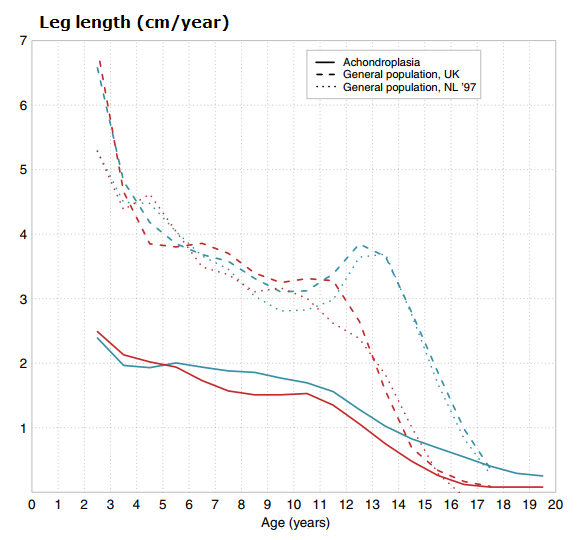
Development of leg length annual increment in achondroplasia and normal population. Boys (blue), Girls (red).
From Merker 2018, Development of body proportions in achondroplasia
Foot length
Foot length is generally somewhat shorter in girls than in boys and developed from about 12.9 at 3 years of age to 21.6 cm at adult ages for boys and from 12.4 cm to 19.5 cm for girls. Equivalent mean values from the general population (Dutch) were from 15.3 to 27.1 cm for males and from 15.1 to 24.5 cm for females (Gerver & de Bruin, 2011).
Foot length in achondroplasia developed at about −4 SDS and adult foot was about 20% shorter than in the general population. It is interesting to note that foot length in the general population is similar in published (Caucasian) references and show less differences than for height (Anderson 1956; Flügel 1986; Gerver & de Bruin, 2011).